
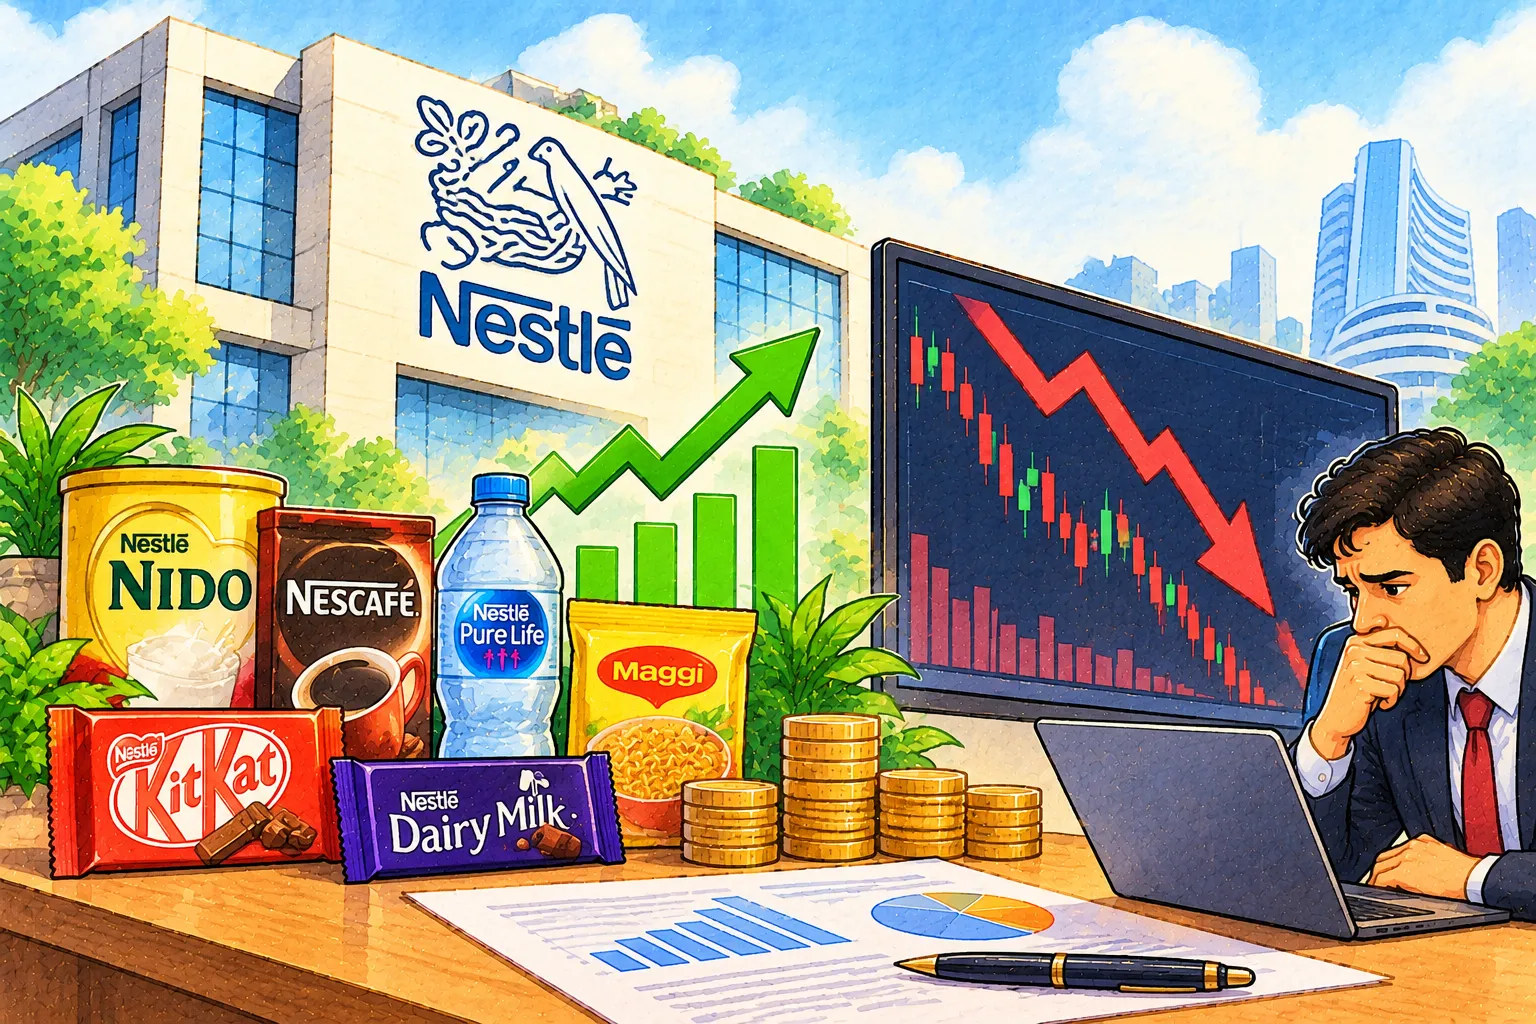
Nestle India reported a 36.3% jump in Q2 FY27 net profit to ₹1,026.70 crore on October 15, broadly in line with estimates, but its shares fell as much as 9% intraday on the NSE.
Q2 FY27 Results at a Glance
Nestle India posted a net profit of ₹1,026.70 crore for the quarter ended September 2026, up 36.3% from ₹753.20 crore a year earlier. Sales rose 20.5% year on year to ₹6,782.17 crore, from ₹5,630.23 crore in the same quarter last year. Exports grew 22% to ₹267.3 crore.
| Metric | Q2 FY27 | Year-ago quarter | Change |
| Net profit | ₹1,026.70 crore | ₹753.20 crore | 36.3% |
| Sales | ₹6,782.17 crore | ₹5,630.23 crore | 20.5% |
| EBITDA | ₹1,615.48 crore | ₹1,232.74 crore | 31% |
| Total expenses | ₹5,405.51 crore | ₹4,620.63 crore | 17% |
| Exports | ₹267.3 crore | ₹219.21 crore | 22% |
EBITDA stands for earnings before interest, tax, depreciation and amortisation, and is a common measure of operating profit. Nestle India’s EBITDA grew faster than expenses, which rose 17% mainly because of higher raw material and other costs.
Because sales grew 20.5% while expenses grew 17%, profitability improved. By simple calculation from the reported figures, the EBITDA margin was about 23.8% in Q2 FY27, against about 21.9% in the year-ago quarter. These margin percentages are derived here and were not stated in the source report.
Results Matched What Analysts Expected
The headline numbers were close to forecasts. Analysts had expected net profit growth of 37% to 38%, which translates to ₹1,022 crore to ₹1,034 crore, and revenue of ₹6,765 crore to ₹6,809 crore. Actual profit of ₹1,026.70 crore and sales of ₹6,782.17 crore both fell inside those ranges.
Business Standard’s pre-results preview had pointed to strong volumes, steady demand and premiumisation as drivers for the quarter. That makes the share price reaction notable, because there was no obvious miss in the headline figures.
How the Nestle India Share Price Moved
Nestle India shares fell to an intraday low of ₹1,260 on the NSE on Thursday, a drop of 9%. By 12:55 PM the stock had recovered some ground and traded 4% lower at ₹1,329, with heavy volume of around 54.10 lakh shares. The reported percentages imply a previous close of roughly ₹1,385, which is a calculation and not a reported figure.

- Before the fall, the stock had gained nearly 6% in October.
- It was up 13% in FY27 so far.
- Its 52-week high is ₹1,553, hit on August 7, 2026.
- Its 52-week low is ₹1,159, hit on April 2, 2026.
At ₹1,329, the stock was about 14% below its 52-week high and about 15% above its 52-week low, by simple calculation. The fall came on a day when the Nifty 50 was up 1.7% at 23,015 levels, so the stock moved against a strong market.
Why the Stock Fell Despite In-Line Results
The Business Standard report does not give a specific reason for the sell-off. That is worth stating plainly, because a sharp intraday fall after in-line numbers invites guesses. Without a stated cause from the company or from brokerages in the sources reviewed, the reason for the fall is not established.
Two pieces of context are relevant. First, general market behaviour offers one frame, though it is not a confirmed explanation here: a stock that has risen ahead of results can fall even on in-line numbers, since the numbers may already be reflected in the price. Nestle India had gained nearly 6% in October before results. Second, Business Standard reported on October 15 that analysts see higher sugar prices and input cost inflation as a possible near-term weight on FMCG stocks, with the effect varying by product mix and pricing power. Nestle India’s expense growth of 17% is consistent with that cost theme, though no analyst quoted in the reviewed reports linked it to this share price move.
Also Read: Nifty IT Gains 8.89% in Three Sessions as Earnings, Valuations and AI Rotation Lift Sentiment
What to Watch After the Results
Readers following the stock may track brokerage commentary in the coming days, which usually explains how analysts read the margin and volume details of a quarter. Management commentary on cost trends and festive-season demand would also add detail that the headline figures do not show. Nestle India’s export growth of 22%, though from a small base of ₹267.3 crore, is another line item that analysts typically watch alongside domestic volume growth.
The October 15 session offers a reminder for anyone reading quarterly results: profit growth, sales growth and a stock’s reaction do not always move together. Comparing the actual numbers with analyst estimates, as done above, gives a clearer picture than the headline growth rate alone.